AI Overviews and SEO: One Year, Five SaaS Verticals
AI Overviews and SEO across five B2B SaaS verticals over a year: branded and TOFU clicks erode while high-intent demand and LLM traffic hold or grow.
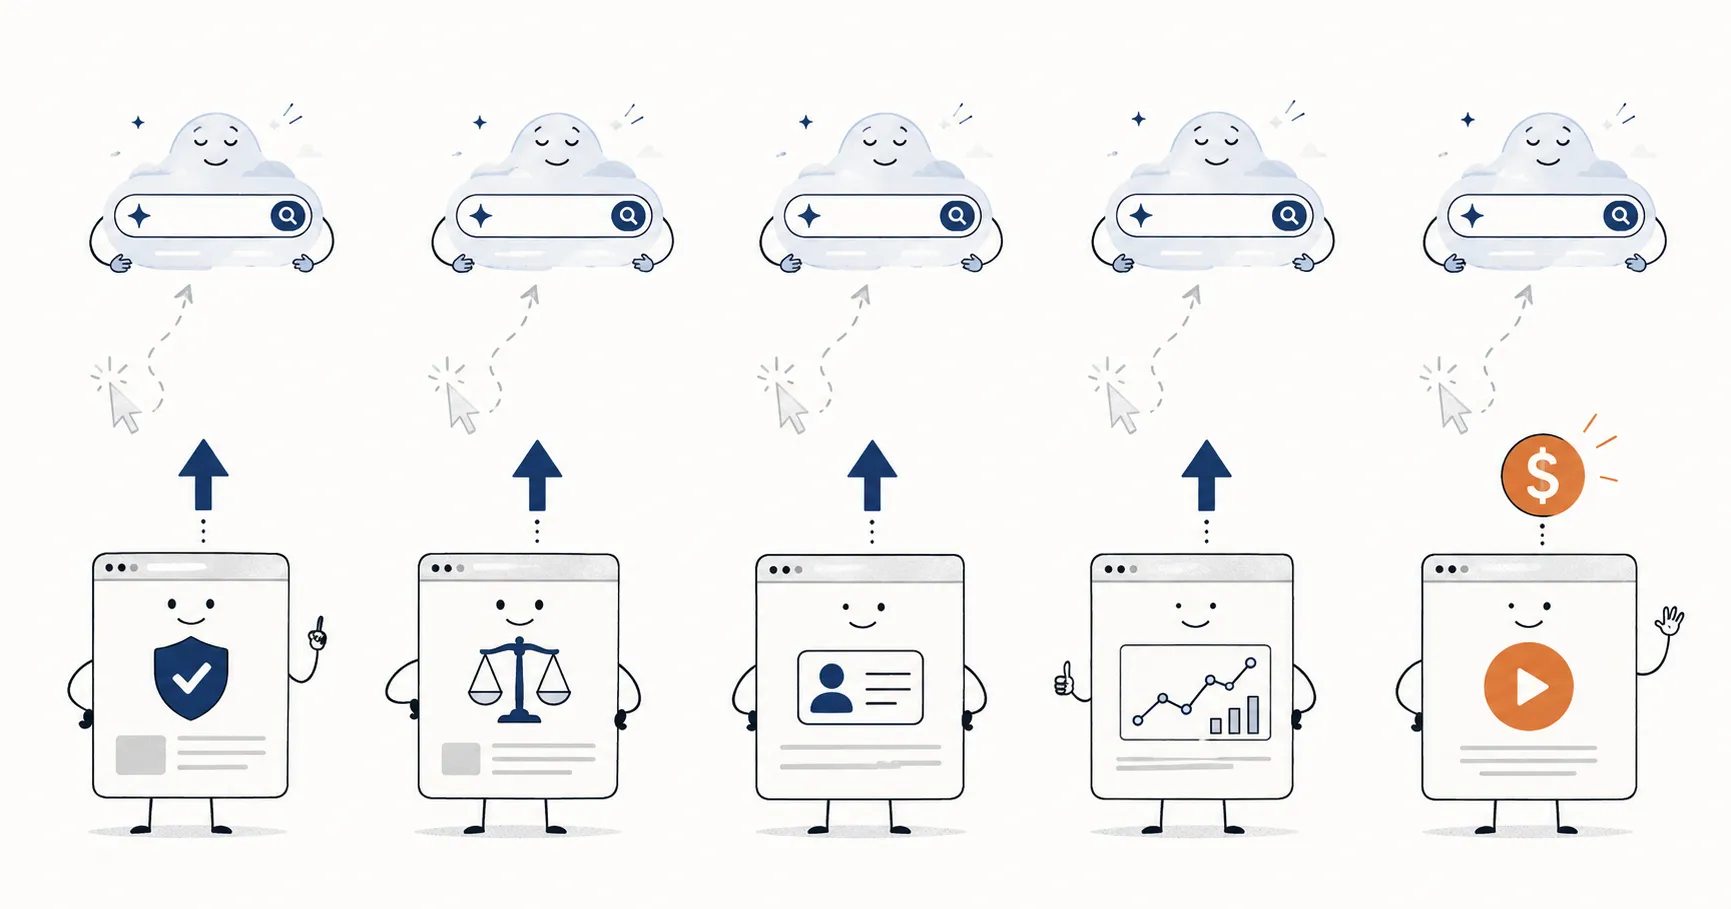
Google AI Overviews change SEO the same way in every B2B SaaS vertical I have run over the past year. Branded and top-of-funnel informational traffic erodes as AI Overviews answer the query on the results page, while bottom-of-funnel, high-intent demand and LLM-referred traffic hold or grow. That pattern is the case for generative engine optimization as a discipline.
Over that year I ran SEO and content for five B2B SaaS accounts: cybersecurity, legal, HR tech, observability, and creator tools. The same shape showed up in all five. This piece is the evidence companion to the Great Decoupling, which defines the pattern in full, and the five sections below show it account by account.
The industry numbers set the stage. BrightEdge tracked AI Overviews on about 48% of queries across nine industries in February 2026, up from about 31% a year earlier, with the average AI Overview now around 1,200 pixels tall. A randomized field experiment by Agarwal and Sen (Indian School of Business and Carnegie Mellon, 1,065 US desktop users, January to February 2026) found AI Overviews cut organic clicks by 38% on the queries where they appeared and raised zero-click searches from 54% to 72%.
Seer Interactive measured organic click-through at 2.36% on AI Overview queries in February 2026, against 3.82% on queries without one. And Google now lets you see your side of it: the Generative AI performance report in Search Console shows your impressions inside AI Overviews and AI Mode, for every website since August 31, 2026 (impressions only, no clicks). Those are the conditions. Below is what they did to five real accounts.
Cybersecurity SaaS: the bottom of the funnel bucked the trend
Start with the cleanest counterexample, because it makes the whole intent argument concrete. On a cybersecurity SaaS account, the overall site was down 26% over a quarter. If you stopped at the top-line number, you would call it a bad quarter and start cutting, which is exactly the misread behind most panics over why Google rankings dropped. But one folder told the opposite story in the same window: a bottom-of-funnel folder grew +27% in BOFU clicks, explicitly bucking the sitewide decline.
Same site, same quarter, opposite directions. Split exactly along intent.
That is the decoupling in a single account, on a single chart. The commodity informational traffic got absorbed. The high-intent pages, where a buyer is evaluating and a synthesized paragraph will not do, held and grew. Same site, same quarter, opposite directions, split exactly along intent. The page mix showed the same shape: total organic sessions dipped about 4.5% while pricing-page sessions rose 7.6% and platform-page sessions nearly 24%. The pages that sit closest to a purchase grew while the top of funnel gave way.
There was a structural win underneath it too. A foundations folder migration built 1,402 top-10 keywords, up from 909, in a month, a clean lift from getting the architecture right. That folder rebuild ran in its own window, with no schema work riding along, the cleaner follow-up to the rollout I dissected in schema markup for SEO.
Turning that shift into a plan is the work behind my generative engine optimization consulting.
Legal SaaS: organic became the largest demo channel during the AI Overview surge
On a legal SaaS account, a program of content consolidation, a platform rebuild, sitewide schema, and new bottom-of-funnel pages grew organic sessions 63% from October 2025 to March 2026, against the prior six months. The number that justified the budget was the demo count: organic drove 362 influenced demos, 29% of all influenced demos, the single largest channel.
Sessions told you the reach grew. Influenced demos told you the reach was worth paying for, and only that number was tied to revenue. I broke down the full attribution setup in how to measure SEO ROI, because the measurement reframe is the whole game once the click stops being the unit.
The account was also visibly moving onto the AI surface. Its AI Overview appearances rose from 60 to 105 over the period. The brand was showing up inside the answer more often, even as the answer intercepted some of the clicks it used to send.
HR-tech: two broad pages took the AI Overview hit, BOFU held
The HR-tech account is the textbook casualty case, the one that shows you exactly which pages AI Overviews eat. Two broad top-of-funnel pages, the general-knowledge “message” and “quote” type pages anyone can now ask a chatbot to write, lost more than 6,800 and 3,100 clicks in a single month to AI Overviews. Those are precisely the queries a model answers without a source. There was no page good enough to save them, because the format itself is what the AI Overview replaced.
And that traffic does not come back. Say it plainly, because teams keep flinching from it: top-of-funnel informational traffic is gone for good. Any “what is,” any “how to” that is not deeply technical, any “top 100 [anything]” listicle, is getting summarized on the results page and it is not returning.
Ask yourself the honest question: when did you last click into “top 100 motivational quotes” and actually read it? Why would you, when you can ask ChatGPT for the one quote that will land for you right now? That is the whole shift. People do not want the generic list anymore, they want the specific, niche, made-for-them answer, and AI Mode and the LLMs give them exactly that. The page that used to catch that search has nothing left to catch.
Meanwhile the bottom-of-funnel pages held their clicks. Buyers comparing platforms and pricing still needed the specific page. Organic traffic fell month over month for most of early 2026, then posted its first positive month, +6.4%, as the BOFU layer carried the weight the informational pages no longer could. The tell that mattered most: through that decline, the account’s marketing-qualified leads held flat. Traffic fell double digits month over month and lead volume did not follow it down, because the clicks AI Overviews absorbed were the low-intent ones that were never going to convert. The page views dropped. The pipeline did not.
And the account was being read by the new surface directly: its content was cited inside a Google AI Overview. That is the trade the decoupling forces into the open. You lose the commodity click and you gain a citation, and the work becomes making sure the citation names your brand inside the answer.
Observability SaaS: definitional and research content won the early read
The observability account is the newest, onboarded in April, and it offers the cleanest early read because almost no deliberate optimization had shipped yet. With the site held essentially flat, definitional and glossary content plus a first-party research report started winning on their own. Top-3 rankings roughly doubled, about 319 to 679, in two months.
I am calling this an early read, and I wrote it up that way in the observability core-update early read. The honest read is that the core update was rewarding authoritative definitional and research-backed content broadly, the exact content type Information Gain favors. What matters for this dossier is the direction: even before any optimization, the high-value content types moved up while the site sat still.
Creator-tools SaaS: the clearest proof that traffic moved to a new surface
If you only look at one vertical, look at this one, because it shows where the lost clicks actually go. On a creator-tools SaaS account, LLM-referred sessions went from 11,639 in April to 52,786 in May, up 353.5% in a single month, and was pacing toward roughly 134,000 in June. The traffic did not disappear. It migrated from blue links to AI answers.
It also converted. The same window posted a record month of organic subscriptions, +38% month over month, even as some programmatic top-of-funnel content decayed. The decayed pages were the commodity kind a model can answer for free. The value did not evaporate with them, it reappeared on the AI surface and on the subscription line. The full story is in the creator-tools turnaround and audit, including the platform shift I could not have engineered and did not pretend to.
How do AI Overviews affect SEO across B2B SaaS?
AI Overviews affect SEO by absorbing commodity informational clicks into the results page while high-intent demand and AI-surface referrals keep growing. Five different businesses, five different buyers, five different content libraries, and one shape across all of them.
| Vertical | What AI Overviews did | The number that mattered |
|---|---|---|
| Cybersecurity | Site down 26% in a quarter | BOFU folder +27%, opposite direction |
| Legal | AI Overview appearances 60 → 105 | Sessions +63%; organic = 362 demos, 29%, largest channel |
| HR-tech | Two broad pages lost 6,800 + 3,100 clicks | BOFU held; first positive month +6.4%, MQLs flat |
| Observability | Site flat, no optimization yet | Top-3 rankings ~319 → 679 in two months |
| Creator-tools | Programmatic TOFU decayed | LLM sessions 11,639 → ~134,000; subs +38% |
Cybersecurity showed the split inside a single quarter: a BOFU folder up 27% while the site was down 26%. Legal showed organic growing straight through the AI Overview surge: sessions up 63% and 362 influenced demos, the largest channel. HR-tech showed exactly which pages lose: two broad pages down 6,800-plus and 3,100-plus clicks while BOFU held and total traffic turned positive again. Observability showed the high-value content types rising before any optimization. Creator tools showed the destination: traffic and conversions moving onto the LLM surface, roughly 11x in two months.
One account is an anecdote. Five verticals over a year is a pattern. AI Overviews are not killing demand. They are redistributing where it shows up, and they are doing it the same way regardless of industry. If your reporting only watches total organic clicks, every one of these accounts looks like a decline. Cut the data by intent and surface, and you see the value, plainly, where it actually went.
What should B2B SaaS teams do about AI Overviews?
B2B SaaS teams should stop chasing the clicks AI Overviews took, because they are not coming back, and make four moves, in order of leverage.
Build for the buyer. Top-of-funnel, what-is content is exactly what an AI Overview answers for free now, as the HR-tech pages proved. Put effort into bottom-of-funnel, decision-stage content where buyers still click, the way the cybersecurity BOFU folder grew while the site fell.
Instrument influenced pipeline. The number that survives is tied to revenue. On the legal account, organic was the largest demo channel at 29% of influenced demos. A report built on sessions would have shown the growth and missed what it was worth.
Earn the answer, and get named in it. Being cited beneath an AI Overview is table stakes. The HR-tech account was cited inside one, and the legal account’s AIO appearances rose from 60 to 105. Structure content with clear claims, first-party data, and schema so the model pulls you in by name. The full playbook, and why being named in the answer is worth more than ranking #10, is in how to rank in AI Overviews.
Follow the traffic onto the AI surface. The creator-tools account is the proof that LLM-referred traffic is real and converts. Track it as its own channel, because for some accounts it is already the growth story.
FAQ
Do AI Overviews hurt SEO traffic?
AI Overviews hurt one kind of SEO traffic and redistribute the rest. Across the five B2B SaaS verticals I ran over that year, broad top-of-funnel and branded informational clicks fell, sometimes sharply: one HR-tech account lost more than 6,800 and 3,100 clicks on two general-knowledge pages in a single month. But bottom-of-funnel, high-intent demand held or grew, and LLM-referred traffic surged on the creator-tools account, from 11,639 to a June pace near 134,000 in two months. The total click count can fall while the value rises, which is why you cannot read AI Overview impact from sessions alone.
How do AI Overviews affect organic click-through rate?
AI Overviews lower organic click-through rate sharply, and unevenly by intent. Seer Interactive measured organic CTR at 2.36% on queries with an AI Overview in February 2026, against 3.82% on queries without one, across 53 brands, because the searcher reads the synthesized answer and often never clicks. The drop concentrates on informational, general-knowledge queries a model can answer without a source. Commercial and comparison queries, where a buyer needs a specific page, hold up far better. That intent split is the single most important thing to control for before you judge an account.
Are AI Overviews good or bad for SEO?
AI Overviews are bad for SEO built on commodity informational traffic and good for brands that get named inside the answer. Seer Interactive found brands cited in an AI Overview earned 120% more clicks per impression than brands left out of it, and on the legal account here, AI Overview appearances rose from 60 to 105 while organic became the largest demo channel. The traffic you lose is the traffic least likely to buy.
Which content loses the most to AI Overviews?
Commodity informational content loses the most to AI Overviews: definitional “what is” pages, general-knowledge templates, and broad how-to content anyone can ask a chatbot to produce. On the HR-tech account, two broad “message” and “quote” type pages lost the most clicks of anything on the site in a single month. Bottom-of-funnel pages (comparisons, pricing, platform pages) and genuinely original, first-party research hold up, because a synthesized paragraph is not a substitute for them.
And the lost traffic does not come back: once a format is something a model can generate on demand, like a quote list or a basic how-to, the page that used to rank for it has nothing left to offer, so do not budget for a recovery that is not coming.
Is this just one account, or a real pattern across SaaS?
The AI Overview effect is a pattern across SaaS. The reason this piece spans five verticals (cybersecurity, legal, HR-tech, observability, and creator tools) is that one account is an anecdote and easy to dismiss as seasonality or a site-specific issue. The same shape across five different businesses over roughly a year is structural: commodity informational traffic absorbed into the results page, high-intent demand and LLM referrals holding or growing. That is the evidence behind the Great Decoupling.
How should B2B SaaS measure SEO when AI Overviews are eating clicks?
B2B SaaS should measure SEO by switching the unit from sessions to influenced pipeline, then track LLM-referred traffic as its own channel. On the legal account, organic drove 362 influenced demos in six months, 29% of all influenced demos, a number no sessions report shows. On the creator-tools account, LLM-referred sessions told a growth story that organic clicks alone would have missed. Measure the demand organic creates and the AI surfaces it now arrives on. The full setup is in how to measure SEO ROI.
What is the alligator effect in SEO?
The alligator effect is the widening gap between impressions and clicks in Google Search Console, named for the way the two lines open up like a pair of jaws (some people call it the crocodile chart or the crocodile-mouth effect). Impressions keep climbing because AI Overviews still surface your page, while clicks flatten or fall because the searcher gets the answer without clicking through. It is the same thing as the Great Decoupling, seen on a single chart.
Across the five B2B SaaS verticals here, the accounts where the jaws opened widest were the ones heaviest in commodity top-of-funnel content. The move is not to try to close the gap on those pages, which you cannot, but to shift effort to the bottom-of-funnel queries that still send the click.
What changed
- November 11, 2026: Replaced the industry figures with sourced data from BrightEdge, Agarwal and Sen's field experiment, and Seer Interactive, and added an answer on whether AI Overviews are good or bad for SEO.
- September 29, 2026: Tightened the writing throughout and linked the related service page.
- July 8, 2026: Added a FAQ explaining the alligator effect, the widening gap between impressions and clicks, and how it relates to the Great Decoupling.